AI for Data Storytelling
Octubre 17, 2024

AI tools like ChatGPT are changing the way we work 🤖, but how effective are they when it comes to data storytelling? 📊 After using ChatGPT for the past two years at OneTandem, I’ve found it to be a useful tool in many areas, yet limited in others. In this article, I’ll share my experiences with what works well—and what doesn’t—when using ChatGPT for data-driven storytelling projects.
In particular, I’ll cover the following:
What works well
- Understanding the problem domain
- Brainstorming stories
- Scripting
- Copywriting
- Color palette
- Emotional touch
What doesn’t work so well
- Dependance on previous knowledge
- Creating charts
- Creating mockups
This is quite a long read, but I wanted to be comprehensive, such that you get an idea of the different tasks that I undertake when I create a new storytelling project. At the same time, the article focuses on ideas rather than specific examples or “step by step how to guidelines”. My objective is to open your eyes to new things that perhaps you were not aware of. In follow-up posts, I will cover specific points, providing examples to illustrate them.
What Works Well? ✅
🔍 Understanding the Problem Domain
As data storytellers, we often have to explain concepts we aren’t deeply familiar with. For instance, I might work on a project about SDGs one day, then switch to another about adolescent challenges or innovation the next.
In these situations, ChatGPT serves as a helpful teacher 🎓. It breaks down complex topics, helping me grasp the essential ideas behind the data. This foundational understanding is crucial for building meaningful stories around data.
ChatGPT also excels at summarizing long reports and articles from clients, quickly surfacing key insights. And when I need a quick self-assessment, I even ask ChatGPT to create quizzes to test my knowledge!
💡Brainstorming Stories
Sometimes, you’re just given some data and asked to create a narrative without much further indications. Where to start, particularly if you are not familiar with the data? ChatGPT can help.
First, I need it to know about our dataset. For private data, I describe the key indicators and dimensions; for public data, I upload the dataset directly.
Second, I provide ChatGPT with context—such as the industry, audience, and problem domain—.
After completing these two steps, I ask questions like:
- “How can I analyze the data to find impactful conclusions 🎯?”
- “What interesting stories could this dataset reveal?”
- “What are the meaningful questions that need answers?”
Starting with this open questions, and then going through some back-and-forth, I generate specific storytelling ideas that I can later test against the data to see if they lead to meaningful insights.
🎬 Scripting
Once I have the key ideas and visuals clear, I go on to create a cohesive script. Again, ChatGPT can be helpful. I provide it with detailed information about the content of my data story, and then ask things like:
- Create a script that follows a traditional three-act structure
- Create a script that flips the traditional three-act structure (I find it very useful to ask ChatGPT to create one thing and the opposite, to boost creativity)
- Think of 3-4 “turning points” in the story—critical moments that will recapture the audience’s attention
Finally, do not forget that you can ask ChatGPT to reformat your conversation 🔄 in a way that’s useful for you. Many people are not aware of it and get lost in really long chat sessions. Just ask for a summary. For instance, if I am creating a presentation, I might ask for a summary of the ideas we discussed in the chat session, formatted in a table with the following columns:
- Slide number
- Slide name
- Main insight
- Suggested content (text/chart/image)
🖋️ Copywriting
I’ve offloaded much of the tedious commercial and administrative writing to ChatGPT. But it’s also a valuable source of creativity. Here’s how I specifically use it for data storytelling:
- Create shorter texts: Often, we need to convey a lot with very few words. ChatGPT is great at this—just paste your long text and ask it to condense it to a specific character or word limit.
- Create alternative titles: A compelling title can make or break a chart’s impact. Instead of settling for generic titles like “Sales Trends in 2024,” I ask ChatGPT to generate several title options, each focusing on different aspects of the data. This ensures I land on a title that resonates with my audience 🎵 .
- Suggest chart annotations: I’m a big fan of chart annotations 📝 to make the data message clearer and to guide the audience’s attention to key points. I upload my charts to ChatGPT and ask it to suggest annotations, as well as ideas on how to best integrate them within the chart layout.
- Change tone or style: This is especially useful when I’m writing in a language other than my native ones. I ask ChatGPT to adjust the tone or style of my text, making it more persuasive, formal, or engaging depending on the context. Sometimes, I even ask it to write in the style of specific publications like The New York Times.
🎨 Color Palette
While there are great tools for creating color palettes, ChatGPT can assist as well. By providing a couple of base colors (such as a client’s brand colors), I can ask it to generate complementary palettes. In particular, I ask for:
- a color for positive/good and a color for negative
- a color for main text and a color for secondary text
- a 5-color categorical color palette
❤️ Emotional Touch
Data storytelling isn’t just about numbers—it’s also about creating an emotional connection with the audience. Surprisingly, ChatGPT has been a useful tool in this area, helping me brainstorm personal stories or case studies that resonate with the data.
For example, when presenting on data about poverty, it’s more impactful to begin with a human story rather than a statistic. ChatGPT can help find relevant news stories or case studies that add this emotional dimension to the narrative.
Related to this, you can also try and use emoticons to spice up 🌶️ a piece of text. Just copy and paste your text, and ask ChatGPT to suggest emoticons and where to use them.
What Doesn’t Work So Well? ❌
🧠 Dependance on previous knowledge
The more knowledge I have about a particular area, the more useful my interactions with ChatGPT become. For instance, when discussing topics like data visualization and storytelling—subjects I’m very familiar with—I can recognize when ChatGPT’s suggestions are off-track. This allows me to guide the conversation, ask for revisions, and eventually arrive at better solutions.
Hence, the advantages I’ve listed earlier may not apply to everyone. The quality of the final output depends heavily on how well you can identify what’s useful and what’s not, which is easier when you deeply understand the topic.
For example, while ChatGPT can suggest color palettes, it may not consider essential aspects like accessibility 👁️ for colorblind users or proper contrast for text. If I don’t specifically ask it to factor in these concerns, the color suggestions may be suboptimal.
📉 Creating Charts
While ChatGPT can generate basic charts, they’re not up to the standards required for high-quality presentations or storytelling. For quick data exploration, it might work, but for polished storytelling not so much. Plus, if you are fluent with tools like Tableau or Observable, you’ll be much faster at data exploration than using ChatGPT.
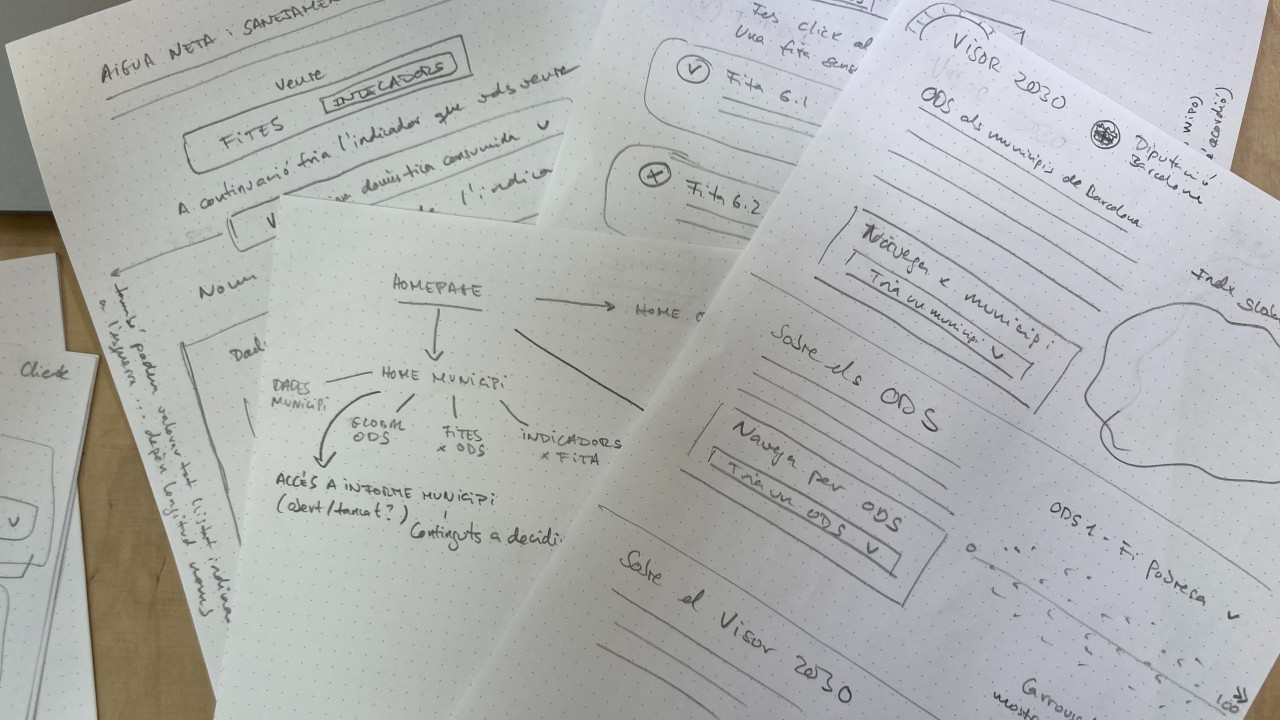
🖼️ Creating Mockups or Prototypes
I’ve found that using ChatGPT for image generation, such as creating basic website mockups, just doesn’t deliver. The results are often awkward and impractical. Paper and pencil remain my go-to for quick mockups. While I wish there were an efficient way to turn paper prototypes into digital ones, I’ve yet to find a reliable solution. Do you know of any?
🚴 Closing thoughts
In summary, ChatGPT has proven to be a valuable tool in many aspects of data storytelling—especially in helping me grasp complex topics, brainstorm creative ideas, and craft compelling texts.
However, it has its limitations, particularly when it comes to generating visual elements like charts and mockups.
I’ve also learned that success with ChatGPT depends largely on how well you can refine its outputs and guide it with clear, detailed follow-up prompts. In the context of this article, it means that the more you know about data storytelling and visualization, the better your results will be.
It’s also a reminder that AI isn’t just a tool for boosting productivity; it’s about improving outcomes. At least, that’s how I see it. I don’t use AI to write faster—I use it to write better.
As Steve Jobs famously said, "computers are like bicycles for the mind," but they don’t replace the mind altogether.

Chief Strategy Officer
El Pere ha fundat OneTandem per dedicar-se al que més li agrada: ajudar a les empreses, organitzacions i persones a transformar dades en coneixement. Compta amb més de 15 anys d’experiència en diferents projectes digitals, i imparteix classes a ESADE, UAB i UPF.

T'ha agradat? Comparteix!