inicio
proyectos
características
servicios
desarrollo y diseño
formación
quiénes somos
contacto
blog
EN
ES
CAT
inicio
proyectos
características
desarrollo y diseño
formación
quiénes somos
contacto
blog
EN
ES
CAT
Blog
Todos
Storytellling
Diseño
IA
Exploración de datos
Política Pública
Todos
Storytellling
Diseño
IA
Exploración de datos
Política Pública
Pere Rovira
Febrero 05, 2025
Comics and Dataviz
Can narrative techniques inform the way data stories are crafted?. We think so, leading to a more emotional, engaging, and memorable approach to data visualization.
Storytellling
Pere Rovira
Octubre 31, 2024
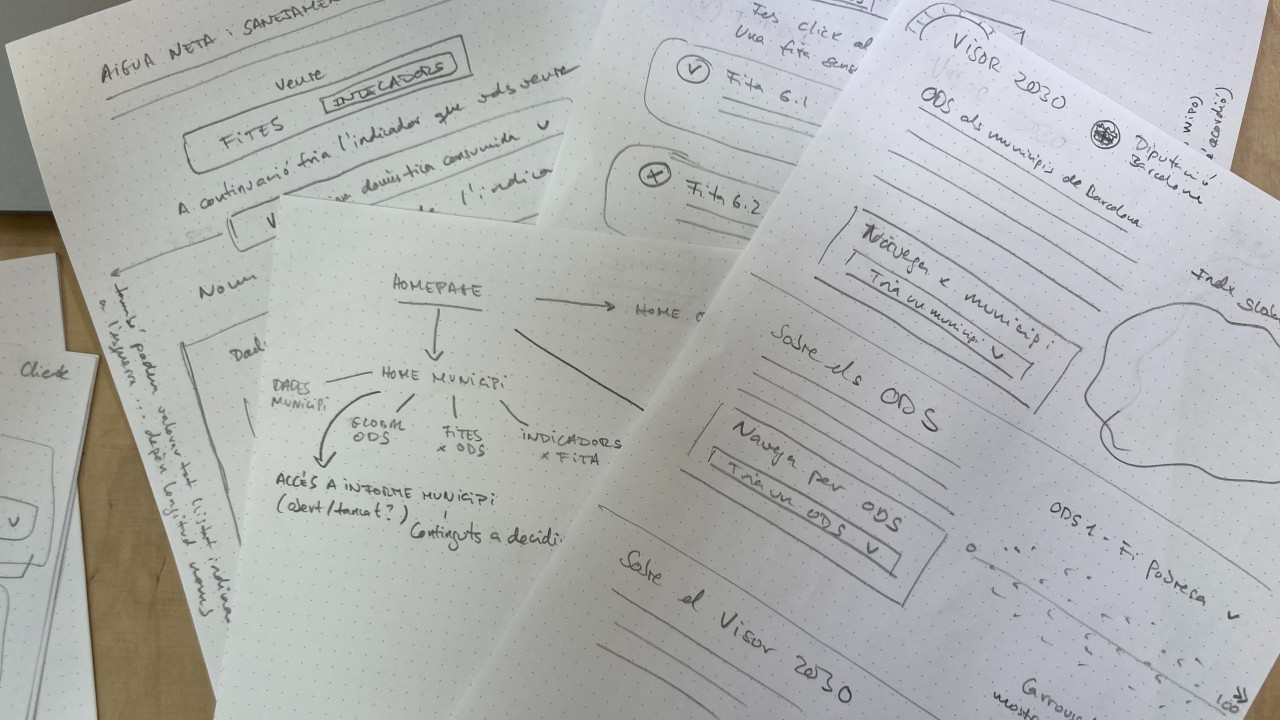
Paper and Pencil
Embracing paper prototyping brings clarity, focus, faster collaboration, and a renewed sense of creativity—reminding us that great design often begins off-screen.
Storytellling
Diseño
Pere Rovira
Octubre 17, 2024
AI for Data Storytelling
Used well, AI tools like chatGPT can boost creativity, clarity and emotional impact in data stories, though they still fall short on polished visuals and charts.
IA
Storytellling
Pere Rovira
Octubre 17, 2024
Visualizar el bienestar subjetivo
Durante décadas, indicadores económicos como el PIB han sido la principal medida del progreso de un país. ¿Pero realmente capturan cómo se sienten las personas respecto a sus vidas?
Exploración de datos
Política Pública