home
projects
features
services
design & development
training
about us
contact
blog
EN
ES
CAT
home
projects
features
design & development
training
about us
contact
blog
EN
ES
CAT
Blog
All
News
Storytellling
Design
AI
Data exploration
Policy
All
News
Storytellling
Design
AI
Data exploration
Policy
Víctor Pascual
July 03, 2025
We won an Information Is Beautiful Award!
We won Silver at the 2024 Information is Beautiful Awards for our project on adolescent girls in Africa. A proud moment for our team.
News
Pere Rovira
February 05, 2025
Comics and Dataviz
Can narrative techniques inform the way data stories are crafted?. We think so, leading to a more emotional, engaging, and memorable approach to data visualization.
Storytellling
Pere Rovira
October 31, 2024
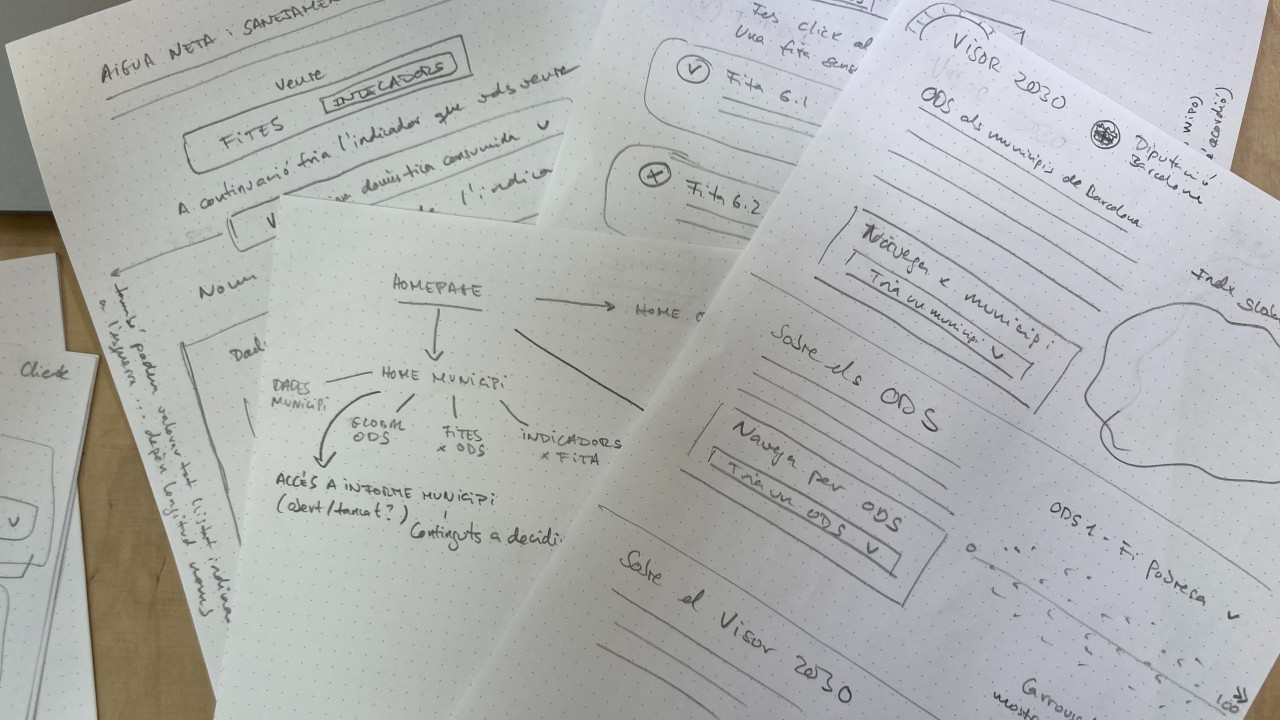
Paper and Pencil
Embracing paper prototyping brings clarity, focus, faster collaboration, and a renewed sense of creativity—reminding us that great design often begins off-screen.
Storytellling
Design
Pere Rovira
October 17, 2024
AI for Data Storytelling
Used well, AI tools like chatGPT can boost creativity, clarity and emotional impact in data stories, though they still fall short on polished visuals and charts.
AI
Storytellling
Pere Rovira
October 17, 2024
Visualizing subjective well-being
For decades, economic indicators like GDP have been the primary measure of a country’s progress. But do they truly capture how people feel about their lives?
Data exploration
Policy